

Blog 3: Design of Experiment (DOE)

What is DOE?
Imagine you are trying to make popcorn by using microwave. You have got different bowl size to place the popcorn kernels, microwave with different power and timing setting. Now, you want to figure out the best combo for maximum number of "pop" corn. Do you just randomly use any bowl given and anyhow adjust the microwave setting? Nope! YOU NEED A PLAN.

Design of Experiment is a structured methodology to obtain knowledge of a complex, multi-variable process with a fewest trial possible to figure out how different factors affect the result, the amount of unpopped kernels in this case. Instead of guessing, you test different combination in a smart and organized way to find the best outcome in the shortest amount of time.
A case study
In a recent case study, three key factors were identified as potential contributors to popcorn yield efficiency:
1. Bowl Diameter (Factor A)
10 cm
15 cm
2. Microwaving Time (Factor B)
4 minutes
6 minutes
3. Microwave Power Setting (Factor C)
75%
100%
The Experimental Setup
A total of 8 experimental runs were conducted, using 100 grams of corn kernels for each trial. The measured outcome was the amount of unpopped kernels remaining after microwaving, recorded in grams. The goal was to understand how each factor influenced the number of 'bullets' left behind.
Full Factorial Design
So, how many number of experiments do we need to conduct?
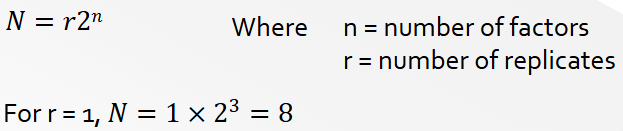
In total, we need to have 8 runs of experiments. The table below shows the full factorial design of all aspect that we need to carry out.
Admin number: 2339632
Run order | A | B | C | Bullets (grams) |
1 | + | – | – | 3.32 |
2 | – | + | – | 2.32 |
3 | – | - | + | 0.74 |
4 | + | + | – | 1.32 |
5 | + | – | + | 0.95 |
6 | + | + | + | 0.32 |
7 | – | + | + | 0.32 |
8 | – | – | – | 3.12 |
Main Effects for Full Factorial Design
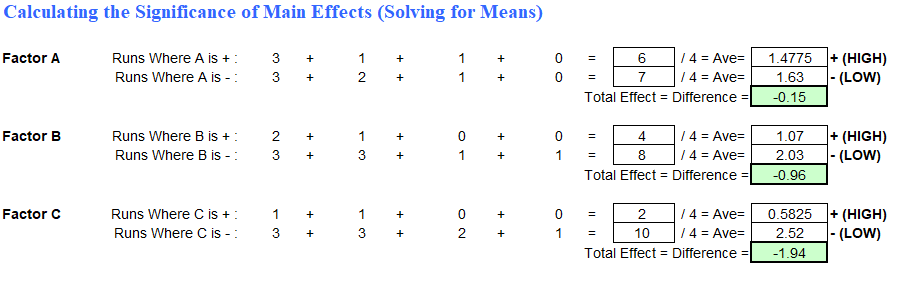
With the results obtained, we calculate the effect of high and low level for each factor on the amount of unpopped kernels. Using the excel template, the value in calculation is rounded up to 1 figure but the final calculation remains the original one.
Below is the graph plotted to show how each factor affects the amount of unpopped kernels.
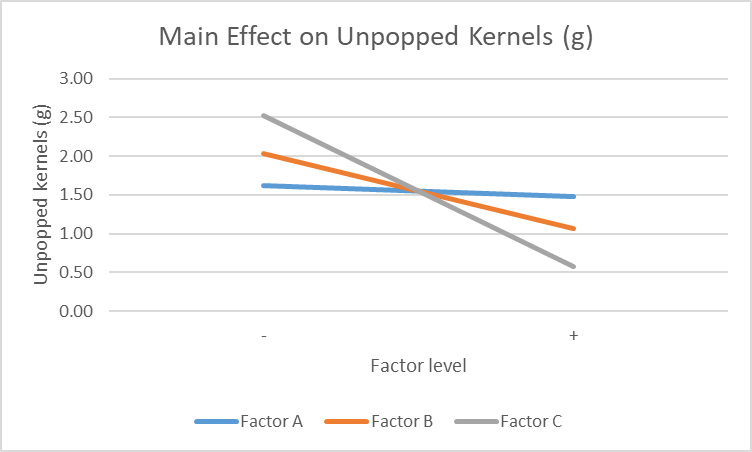
From the graph above, we can infer that,
When bowl diameter increases from 10cm to 15cm, the of weight of bullets left decreases from 1.63g to 1.4775g.
When microwave time increases from 4min to 6min, the weight of bullets left decreases from 2.03g to 1.07g.
When microwave power setting increases from 75% to 100%, the weight of bullets left decreases from 2.52g to 0.5825g.
Ranking of Factor on weight of bullets left
Factor C (Microwave power setting)
Factor B (Microwave time)
Factor A (Bowl diameter)
Why is that so?
Factor C (Microwave power setting) shows the highest gradient of weight of bullets left with a difference of 1.94g between low and high levels, followed by a less steep gradient of factor B (Microwave time) with a 0.96g difference between low and high levels while factor A (Bowl diameter) has the lowest gradient with the least difference of low and high level of 0.15g.
Interaction Effects for Full Factorial Design
Relationship of bowl diameter and microwave time
What is the interaction between bowl diameter and microwave time?
We take the average value of low B low A, high A low B, low A high B and high A high B. A graph is plotted to identify their effect of interaction based on its gradient.
Factor A | - | + | Total effect |
at -B | 1.93 | 2.135 | 0.21 |
at +B | 1.32 | 0.82 | -0.50 |
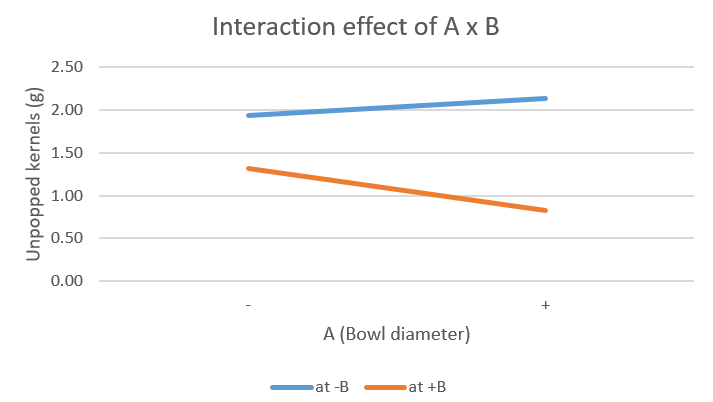
As you can see from the graph above, the gradients of both lines are different (one is + and the other is -). Therefore, there is a significant interaction between factor A and factor B which is the bowl diameter and microwave time.
Relationship of bowl diameter and microwave power
Next, let us investigate the effect between bowl diameter and microwave power setting.
Using the same method as above, we can determine the difference of effect A by visualizing from the graph below.
Factor A | - | + | Total effect |
at -C | 2.72 | 2.32 | -0.40 |
at +C | 0.53 | 0.635 | 0.11 |
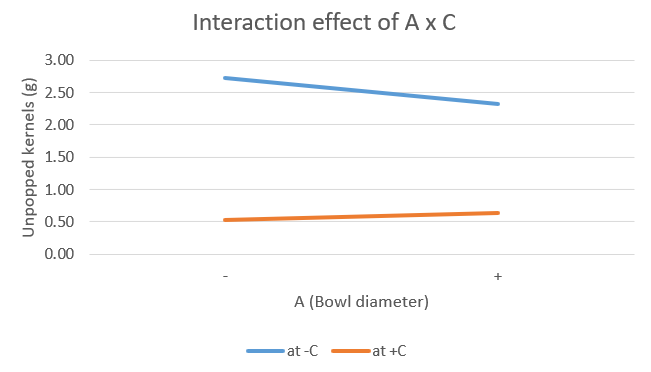
The gradients of both lines are different (one is + and the other is -). Therefore, there is a significant interaction between factor A and factor -C which is the bowl diameter and microwave power setting respectively.
Relationship of microwave time and microwave power
Lastly, we shall look at the effect of microwave time and its power.
Factor B | - | + | Total effect |
at -C | 3.22 | 1.82 | -1.40 |
at +C | 0.85 | 0.32 | -0.53 |
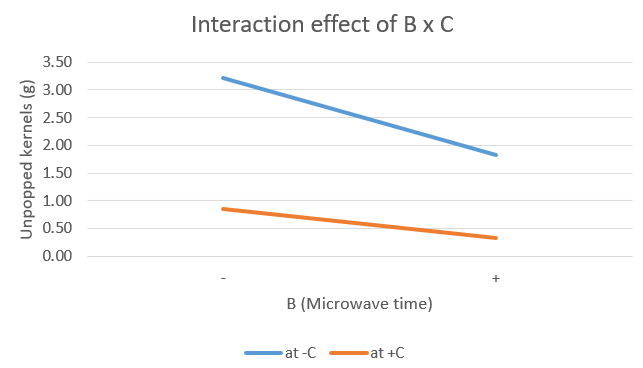
The gradients of both lines are different by a little margin. Therefore, there is a little interaction between factor B and C which is the microwave time and the power setting.
Fractional Factorial Design
After we have understood about the full factorial design, what is the fractional factorial design then? Logically, it is infeasible to run all treatments. It will be more realistic to restrict the number of runs but we still need to provide sufficient information to determine the factor effect. Hence, here is where the fractional factorial design comes in.
So the question is, how should we identify the combinations of factor in order to come up with a valid conclusion that has minimal deviation with the full factorial design?
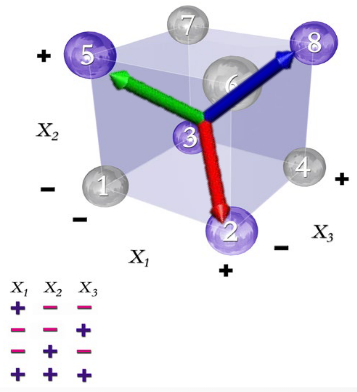
An orthogonal and balanced design must be chosen. All factors must occur (both low and high levels) the same number of times so that it has good statistical properties.
In our case study, run 1, 2, 3, 6 fulfill the criteria of the fractional factorial design.
Run order | A | B | C | Bullets (grams) |
1 | + | – | – | 3.32 |
2 | – | + | – | 2.32 |
3 | – | - | + | 0.74 |
6 | + | + | + | 0.32 |
Main Effects for Fractional Factorial Design
Repeating the same steps as full fractional design to investigate the effects of factor using fractional factorial design.
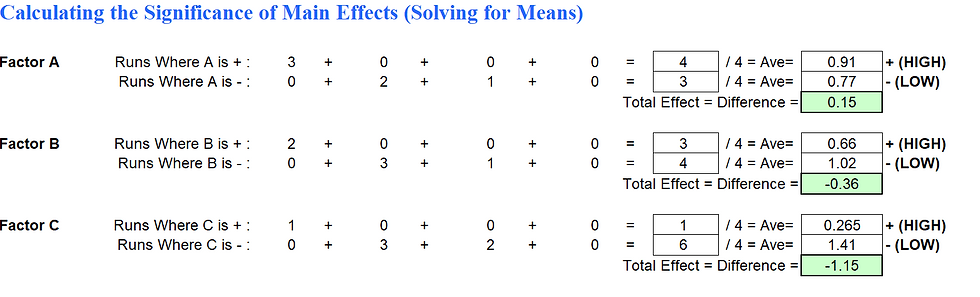
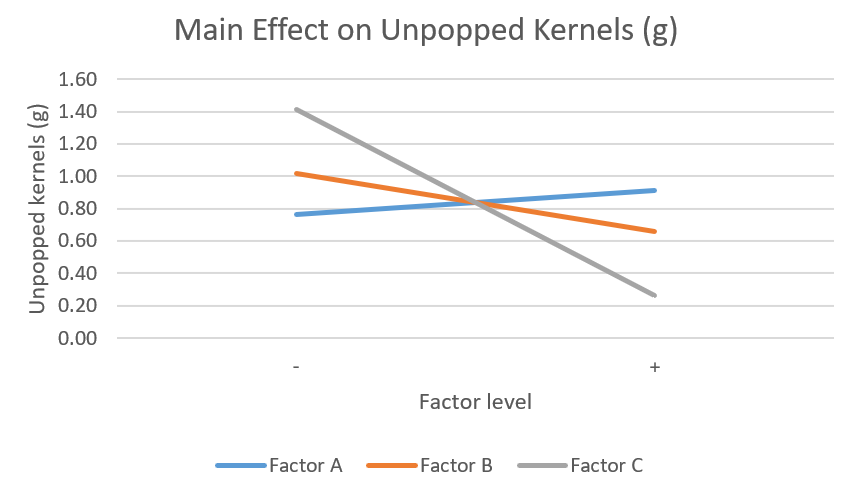
From the graph above, we can infer that,
When bowl diameter increases from 10cm to 15cm, the of weight of bullets left increases from 0.77g to 0.91g.
When microwave time increases from 4min to 6min, the weight of bullets left decreases from 1.02g to 0.66g.
When microwave power setting increases from 75% to 100%, the weight of bullets left decreases from 1.41g to 0.265g.
Ranking of Factor on weight of bullets left
Factor C (Microwave power setting)
Factor B (Microwave time)
Factor A (Bowl diameter)
The reasons are factor C (Microwave power setting) shows the highest gradient of weight of bullets left with a difference of 1.15g between low and high levels, followed by a less steep gradient of factor B (Microwave time) with a 0.36g difference between low and high levels while factor A (Bowl diameter) has the lowest gradient with the least difference of low and high level of 0.15g positive change instead.
Conclusion on main effects of full factorial design and fractional factorial design
Hence, what is the conclusion of using fractional factorial design as compared to the full fractional design?
Using fractional factorial design, it is undeniable that it can save experimental time and costs. However, from the difference of data obtained, we can conclude that fractional factorial design can only be used to identify the most significant factor that affects the experimental result. If the factor does not affect its result much, we cannot use fractional factional design to determine the conclusion of the experiment as it is inaccurate.
In the case study above, the sequence of factors ranking on the weights of popcorn bullets remain the same for both designs. However, the factor that has a least significant effect on the result which is factor A, the bowl diameter, its conclusion deviates with the full factorial design where when bowl diameter increases, the weight of bullets left decreases, which it is a false statement.
Interaction Effects for Fractional Factorial Design
For fractional factorial design, we do not need to take its average value of each combination as there is only 4 sets of experimental data available.
Relationship of effect of bowl diameter and the microwave time
Factor A | - | + | Total effect |
at -B | 0.74 | 3.32 | 2.58 |
at +B | 2.32 | 0.32 | -2.00 |
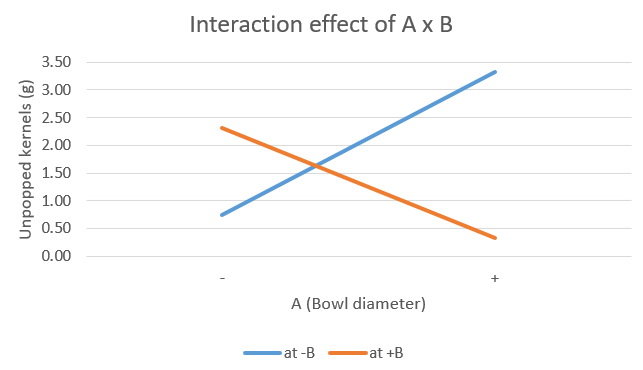
As you can see from the graph above, the gradients of both lines are different (one is + and the other is -). Therefore, there is a significant interaction between factor A and factor B which is the bowl diameter and microwave time.
Relationship of effect of bowl diameter and microwave power
Factor A | - | + | Total effect |
at -C | 2.32 | 3.32 | 1.00 |
at +C | 0.74 | 0.32 | -0.42 |
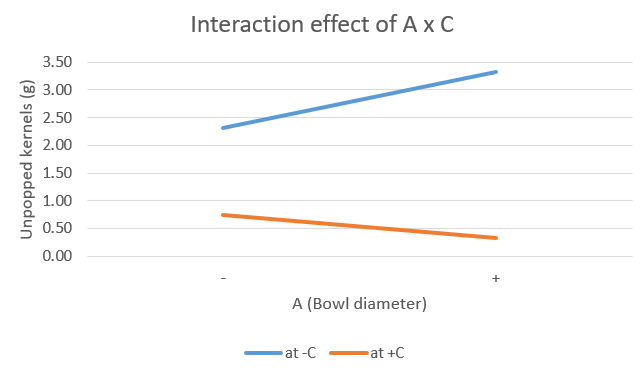
The gradients of both lines are different (one is + and the other is -). Therefore, there is a significant interaction between factor A and factor -C which is the bowl diameter and microwave power setting respectively.
Relationship of effect of microwave time and its power
Factor B | - | + | Total effect |
at -C | 3.32 | 2.32 | -1.00 |
at +C | 0.74 | 0.32 | -0.42 |
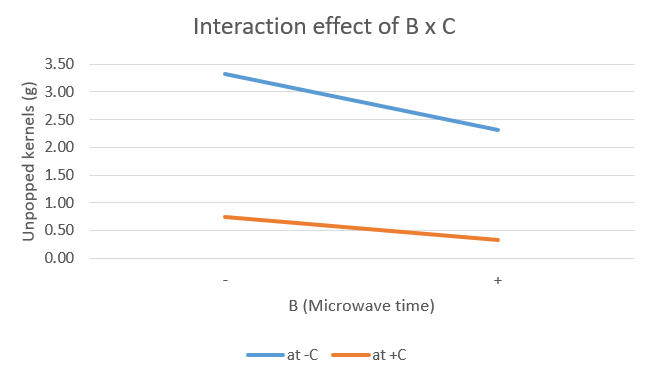
The gradients of both lines are different by a little margin. Therefore, there is a little interaction between factor B and C which is the microwave time and the power setting.
Conclusion on interaction effects of full factorial design and fractional factorial design
Hence, we are also able to conclude that the interaction effects of full and fractional factorial design are the same trend.
Overall conclusion on how to get the most popcorn!
Therefore, to maximize the yield of "popped" corn, we can conclude from the main effect graphs that factor C which is the microwave power setting is the most significant effect. Hence, higher power can be set. On top of that, the interaction effect between A x B and A x C are significant. as shown by the non-parallel lines shown in both full and fractional factorial design. To evaluate the combined effects, we will systematically test combinations of factor A and C to find the optimum pairing. By optimizing the settings of this interaction, we should be able to establish the ideal conditions to "pop" most of the kernels!
Learning reflection in tutorial and practical
During the tutorial, I was introduced to the concept of DOE for the first time. This method caught my attention as it significantly simplifies the experimental process. Especially in my field of study chemical engineering, this concept minimizes guesswork when we want to discover relationships between variables and optimize results. For example, in product design and chemical processes improvement. Thus, it improves the efficiency of our experimental work.
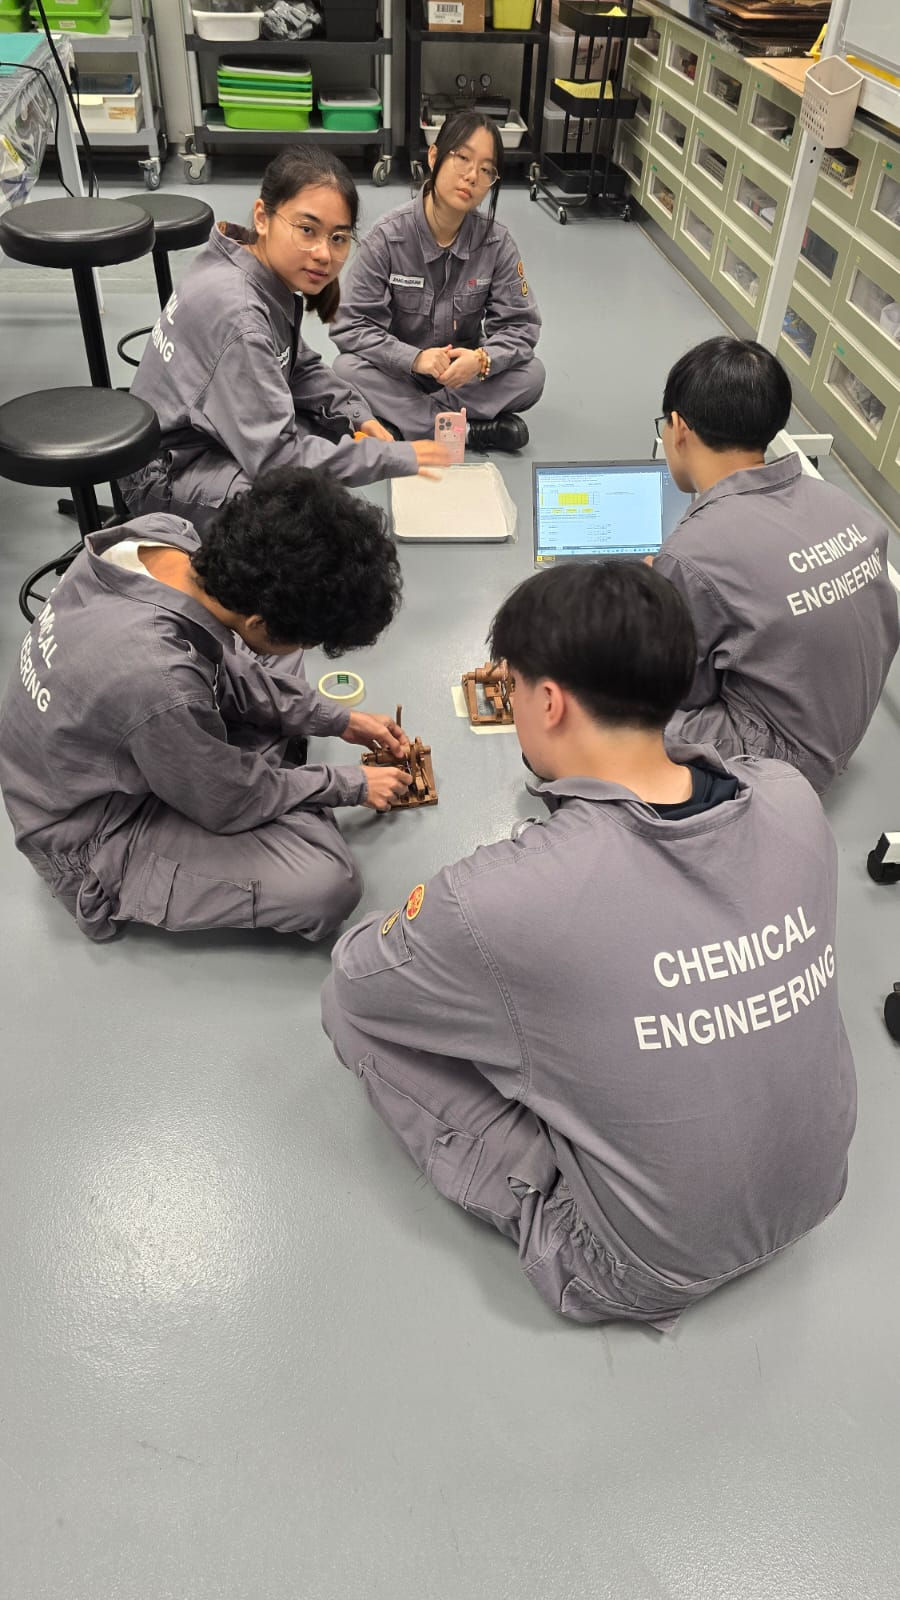
Above is a photo of me and my teammates in the practical. During practical session, we were tasked to launch a projectile and measure the distance it travelled based on 3 factors 2 levels which applied DOE principles. What I have learnt in this practical was Consistency is crucial in experimental work. The factor settings and combination must be shuffled for different runs in an experiment to account for the inconsistency due to external factor like air resistance, misalignment of launcher and so on that can lead to inaccurate results. Hence, the combinations should be tested thoroughly to avoid resulting incorrect conclusion from the unreliable data obtained.
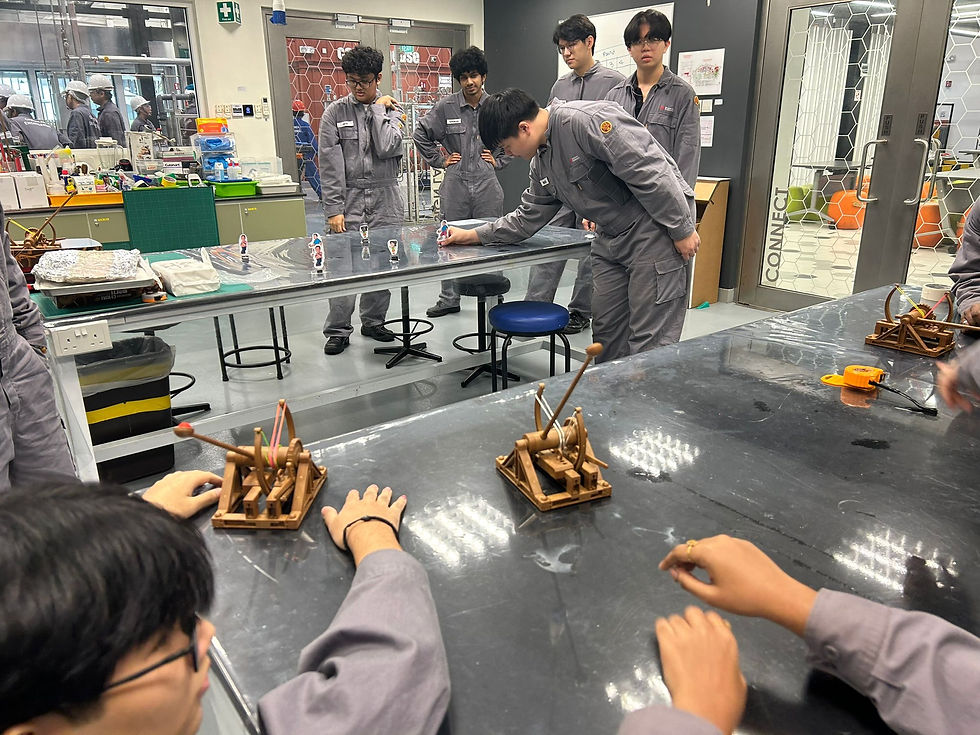
Next, moving on to the exciting activity that we did during practical! Some of the other key takeaways are the importance of critical thinking. In the last activity in the practical, we had the opportunity to aim the projectile at photos of our lecturers😀. One of the team used a perfect strategy, which is to place the launcher at the same optimal position and adjust the angle systematically. This method not only reduced the time spent repositioning the launcher but also improved the accuracy of shots by keeping the setup consistent.
Hence, I have learnt to think before we start to do anything instead of spending time on trial and error to improve the efficiency of our work in future. On top of that, be humble and open to always learn from others, there are many things other know that we don't. Observe others and apply everything that we have learnt from our mistake to continuously make impactful improvement in life.


Comments